Apple Is Not A Buy: Too Overvalued And The Earnings Are Not Outstanding (NASDAQ:AAPL) – Technologist
Wirestock
According to Berkshire Hathaway’s second quarter earnings report, Warren Buffett’s Berkshire Hathaway (BRK.A) (BRK.B) cut its stake in tech giant Apple (NASDAQ:AAPL) by almost 50%.
Berkshire’s disclosed holdings in Apple were valued at $84.2 billion at the end of the quarter, falling from 790 million shares to 400 million shares. The dramatic selloff is not typical of Buffett because the Oracle of Omaha normally holds his stocks for decades. It seems to me that the reasons for this were quite significant. I will try to explain these in this article.
Since my last article on Apple the corporation has not improved its results much. Do not take me wrong. Apple has just reported a sound set of results, but not brilliant for such a popular company.
Summary of my previous article on Apple
When I wrote the article, Apple’s stock price was down largely due to the company’s falling sales in China and regulatory pressures. Apple’s fundamentals, including profitability, sales growth, and return on equity, showed signs of stalling. The company’s stock was overvalued at the time. Unfortunately, it is still overvalued now. The recent earnings release was quite good but roughly in line with the company’s previous earnings. Let me also have a look at Apple’s fundamentals, namely financial and valuation indicators.
Apple: quarterly earnings
A lot of analysts have already written and published analyses of Apple’s earnings. So, I will just touch on the key points of Apple’s quarterly report.
Here’s how Apple did versus analysts’ consensus estimates for the last quarter:
- EPS: $1.40 versus $1.35 expected
- Revenue: $85.78 billion versus $84.53 billion expected
- iPhone revenue: $39.30 billion versus $38.81 billion expected
- Mac revenue: $7.01 billion versus $7.02 billion expected
- iPad revenue: $7.16 billion versus $6.61 billion expected
- Wearables, Home, and Accessories revenue: $8.10 billion versus $7.79 billion expected
- Services revenue: $24.21 billion versus $24.01 billion expected
- Gross margin: 46.3% versus 46.1% expected

Prepared by the author based on Seeking Alpha’s data
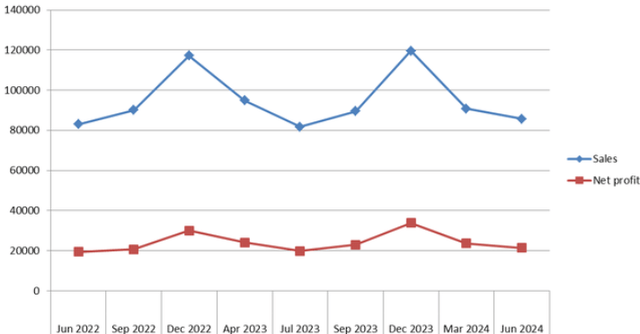
All looks quite fair. But let me compare the recently published numbers to the ones reported for the previous periods. It is widely acknowledged that it does not make sense to compare Apple’s 3Q 2024 quarter to the December quarter because Christmas sales traditionally support Apple’s earnings. Still, if we compare these numbers, we will see that Apple’s June 2024 sales and net profit were substantially higher than the ones reported in December 2023. The June 2024 sales were also lower compared to the March 2024 quarter. Also, the September 2023 quarter was better both in terms of net profit and revenue compared to the June 2024 period. Only the July 2023 and June 2022 periods were somewhat worse, both in terms of earnings and sales, compared to the recently reported period.
The growth rate is almost unseen on the graph below, where I plotted the results from the table above. Although it does not look like a catastrophe on its own, Apple has the reputation of a brilliant, high-growth company and is valued accordingly.

Prepared by the author based on Seeking Alpha’s data
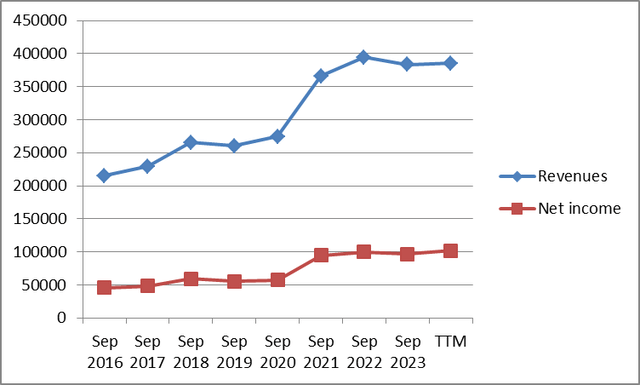
We can also easily see from the annual net profit and sales graph below that in 2022, earnings and sales growth stalled, while the figures reached their peaks.

Prepared by the author based on Seeking Alpha’s data

Prepared by the author based on Seeking Alpha’s data
But let’s dig into more details.
Apple’s business and financial fundamentals
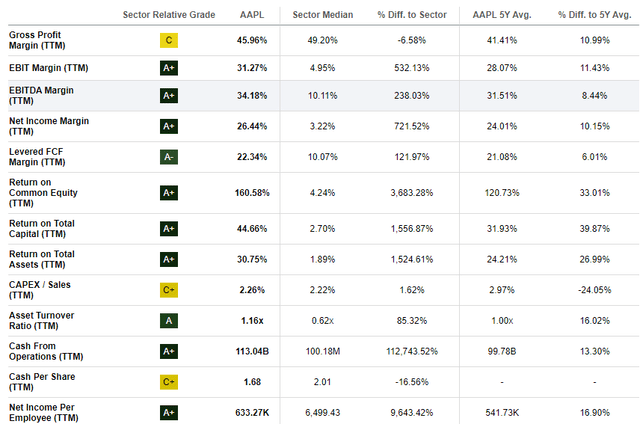
On the surface, it does look like Apple is doing very well. Its profitability indicators are very high compared to the industry’s medians. This is especially true of Apple’s EBIT, EBITDA, net income and levered FCF margins. These are 31.27%, 34.18%, 26.44% and 22.34%, respectively, compared to the sector’s medians of 4.95%, 10.11%, 3.22% and 10.07%. Even more brilliant are the corporation’s efficiency indicators, namely return on common equity, return on total capital and return on total assets. These are 3,683.28%, 1,556.87% and 1524.61% higher than the sector’s average indicators!

Seeking Alpha
If we compare the profitability and efficiency ratios of Apple to those of its key competitors, we will also see that Apple’s indicators are much better. This is particularly true of Apple’s net income margin, which is 26.44%, much higher than Dell’s (DELL) 4%, Xiaomi’s (OTCPK:XIACY) 6% and HP’s (HPQ) 5.6%.

Seeking Alpha
What could be wrong? But if we have a closer look at Apple’s other indicators, namely its cash and debt position, the picture is not as bright. Indeed, Apple’s net debt is negative, which is very good. This is due to the fact the corporation has been recording positive net income for many years. That is why it holds tons of cash on hand. Apple also has a good coverage ratio, higher than many of its peers, including Dell and HP. This means that Apple can pay its interest more than 30 times. The debt-to-free cash flow ratio is lower than its peers’.
However, if we have a closer look at Apple’s other indicators, namely current and quick ratios, these do not suggest the company is a cash cow. In other words, Apple’s current assets are lower than its current liabilities. Some of the company’s peers, namely Xiaomi and SMCI (SMCI), have higher current ratios. The long term debt/total capital ratio is the long-term debt divided by the sum of long-term debt and shareholder’s equity. A good long-term debt-to-total capitalization ratio is anything below 1.0. From this viewpoint, Apple’s long term debt/total capital ratio is good but higher than some of its competitors’, namely Xiaomi’s, SMCI’s and FUJIFILM Holdings Corporation’s (OTCPK:FUJIY).

Seeking Alpha
We can safely say that many of Apple’s indicators, especially the ones linked to profitability, are excellent, but some are not so much so.
AAPL stock: valuations
One of the most important parts of Apple’s story is its valuations.
Below, I have prepared a table of forward valuation ratios. All of these valuation ratios are above the sector’s medians. But the highest valuation metrics are Apple’s EV/Sales and P/B ratios. The company’s EV/Sales is almost 3 times higher than the industry’s average, while Apple’s P/B is about 14 times higher than the sector’s median.
|
Indicator |
AAPL’s indicator |
Sector median |
|
P/E Non-GAAP (FWD) |
32.81 |
22.74 |
|
P/E GAAP (FWD) |
32.85 |
27.49 |
|
PEG Non-GAAP (FWD) |
2.94 |
1.78 |
|
EV/Sales (FWD) |
8.44 |
2.73 |
|
EV/EBITDA (FWD) |
24.34 |
13.83 |
|
EV/EBIT (FWD) |
26.83 |
19.35 |
|
Price/Sales (FWD) |
8.58 |
2.78 |
|
Price/Book (FWD) |
53.18 |
3.82 |
|
Price/Cash flow (FWD) |
28.05 |
21.14 |
Source: Prepared by the author based on Seeking Alpha’s data
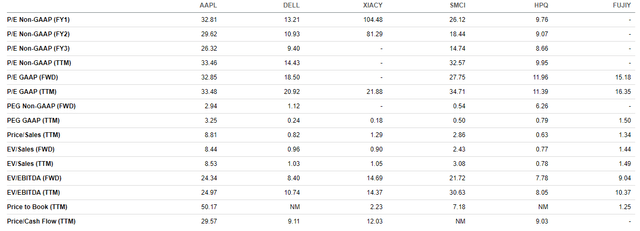
Let us also have a look at Apple’s peers, namely Dell, Xiaomi, SMCI, HP and FUJIFILM Holdings Corporation. Even if we look at Apple’s forward P/E GAAP, it is much higher than Dell’s, HP’s, FUJIY’s and even SMCI’s. But due to Apple’s profitability, its P/E ratios are reasonably low compared to its other metrics, including EV/Sales, P/B. Apple’s EV/Sales is almost 10 times higher than most of its peers’. Apple’s P/B of 50.17 is more than 22 times higher than XIACY’s and 40 times greater than FUJIY’s.

Seeking Alpha
So, overall we can safely say that AAPL stock is much more expensive than its peers’.
Apple’s upside factors
There were some positive announcements made during the conference call. Apple can boast new technologies and business success.
- First, new AI features will be rolled out step-by-step. According to Mr. Cook, the company’s CEO, Apple plans to integrate ChatGPT features into iPhones by the end of this year, thanks to its partnership with OpenAI. According to Cook, Apple’s installed user base reached a record high, which could add fuel to the scale of a potential AI-driven upgrade cycle.
- Then, the company reported record-high revenue from its services segment in the third quarter. Apple’s services revenue totaled $24.21 billion in the third quarter, up 14% from the year-ago period. Apple also expects this growth to continue in the fourth quarter.
Overall, the company is extremely profitable and has plenty of cash. Its stock is also popular among investors. So, it is unlikely to dramatically drop in value.
Apple’s downside factors
The first and foremost risk I have mentioned above is Apple’s overvaluation. Moreover, the growth rate has slowed down, while the company’s market cap is near all-time highs. The profitability indicators are substantially better than their peers’. AAPL stock valuations would make sense if Apple’s EPS and sales growth rates were higher.
Many analysts are saying the global economy is slowing down and is about to enter a recession. This is especially true of China. Apple’s sales in China are also slowing down. Moreover, Apple sells premium-class products, including MacBooks and iPhones. There are much cheaper alternatives. So, if there is a recession and people’s incomes fall, the demand for Apple’s products will likely decrease.
Conclusion
My base-case scenario is that Apple’s stock price would decrease somewhat as a result of the likely recession ahead. The stock is overvalued, and the growth rate reached its peak in 2022. However, the company is still financially sound and has ample amounts of liquidity. I am still neutral on the stock because of its profitability, ample amounts of cash, and popularity among investors. But I do not think it is a buy because of its overvaluation and likely slow growth ahead.

